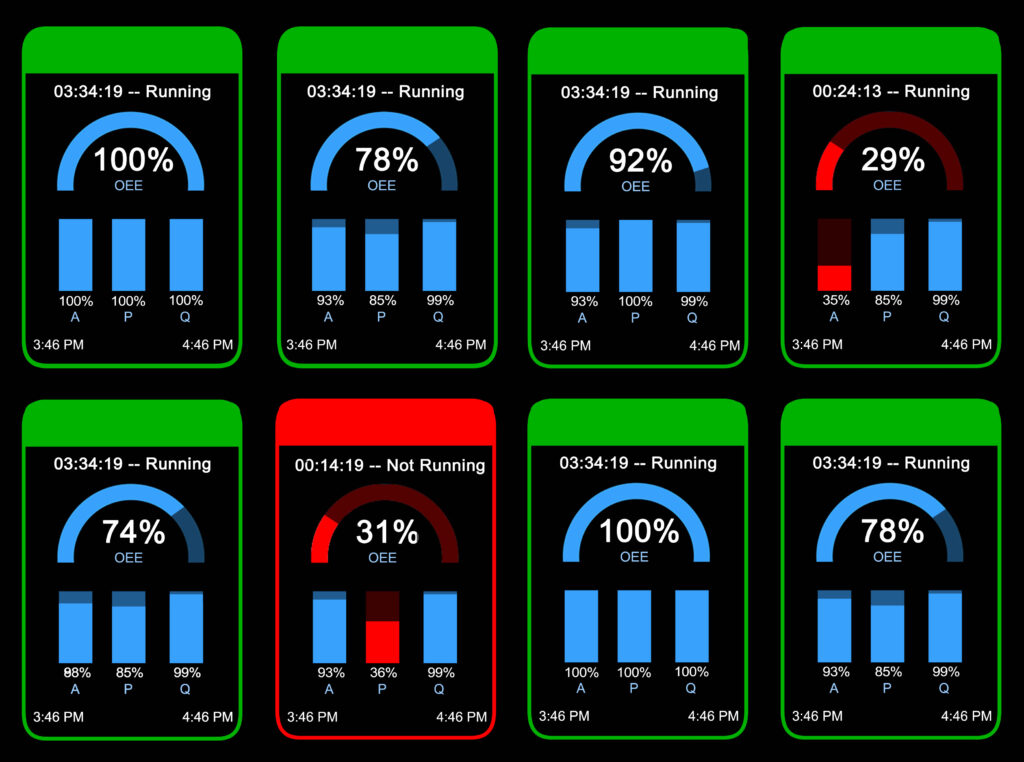
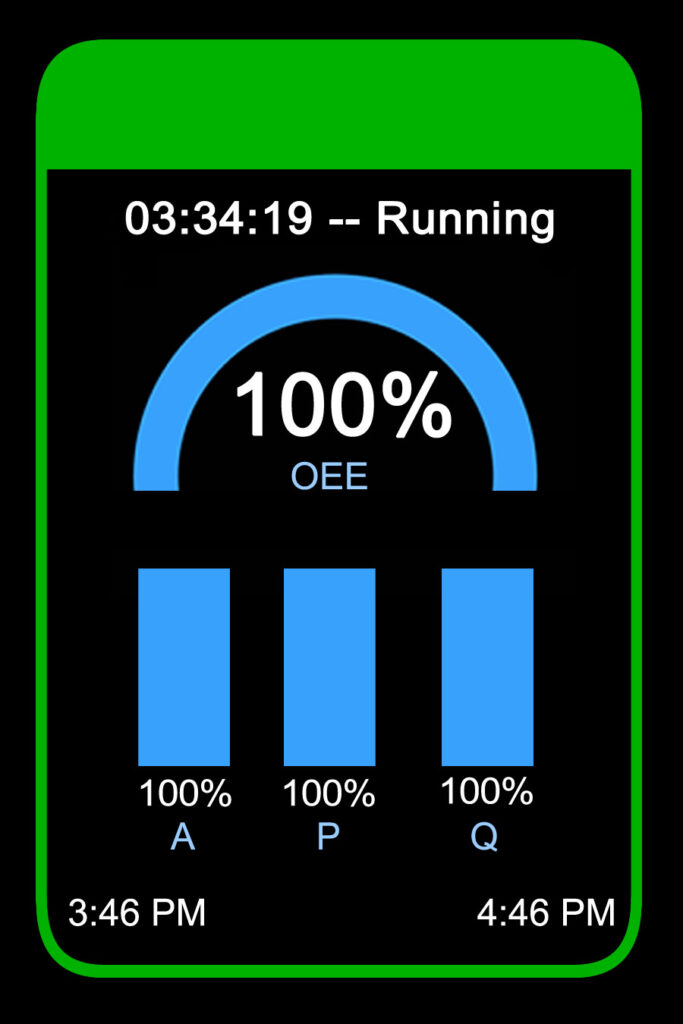
Our first Andon board mock up showed the overall OEE rating, the availability, performance and quality rating, whether the machine was running or not and for how long. (We called this first mock up the Star Trek version. Whenever everything is at 100%, one can imagine the star ship Enterprise.)
Here is what appeared if the user selected four machines per view:
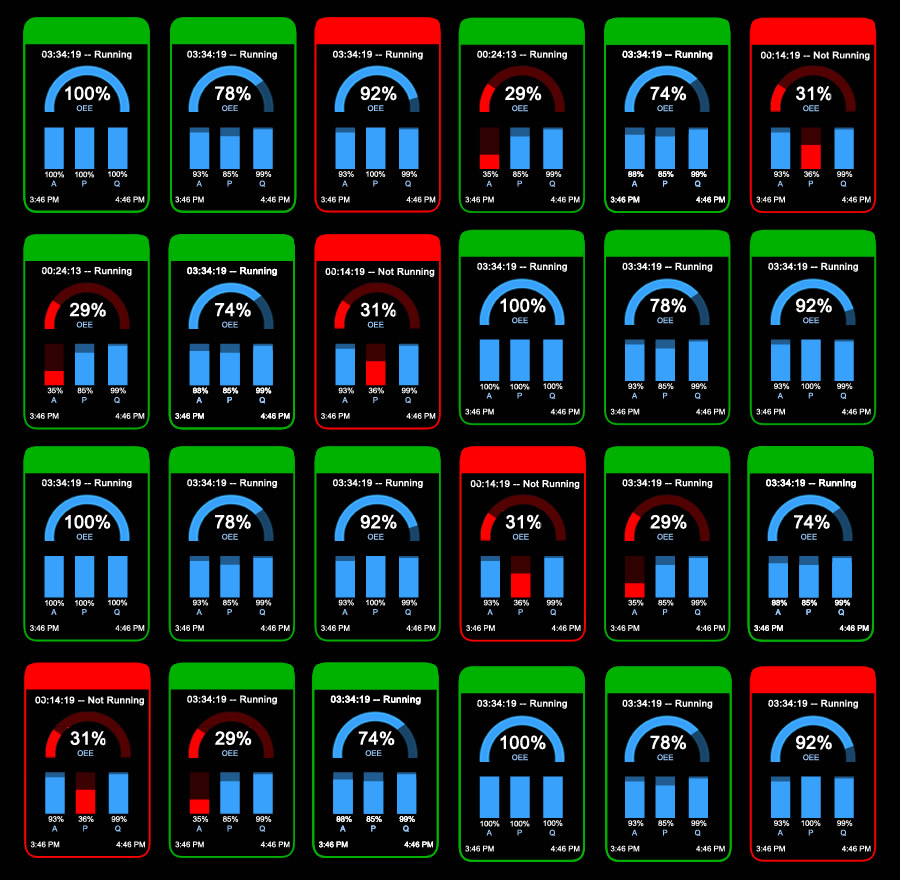
Here is what appeared if the user selected 24 machines per view:
In the image below, all OEE factors are 100%, meaning for the selected time period all OEE factors are 100% and in this example the machine has been running constantly for 3 hours and 34 minutes.
Here the outline is green because the machine is currently running, however, the red highlights show the overall rating has fallen below acceptable levels and it is being caused by low availability.
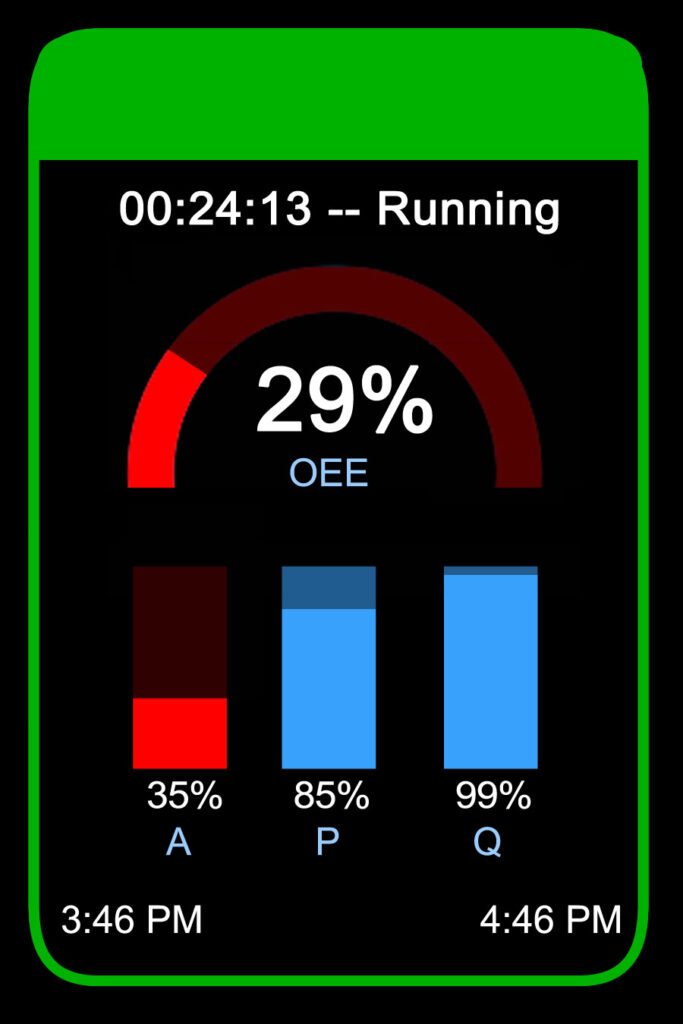
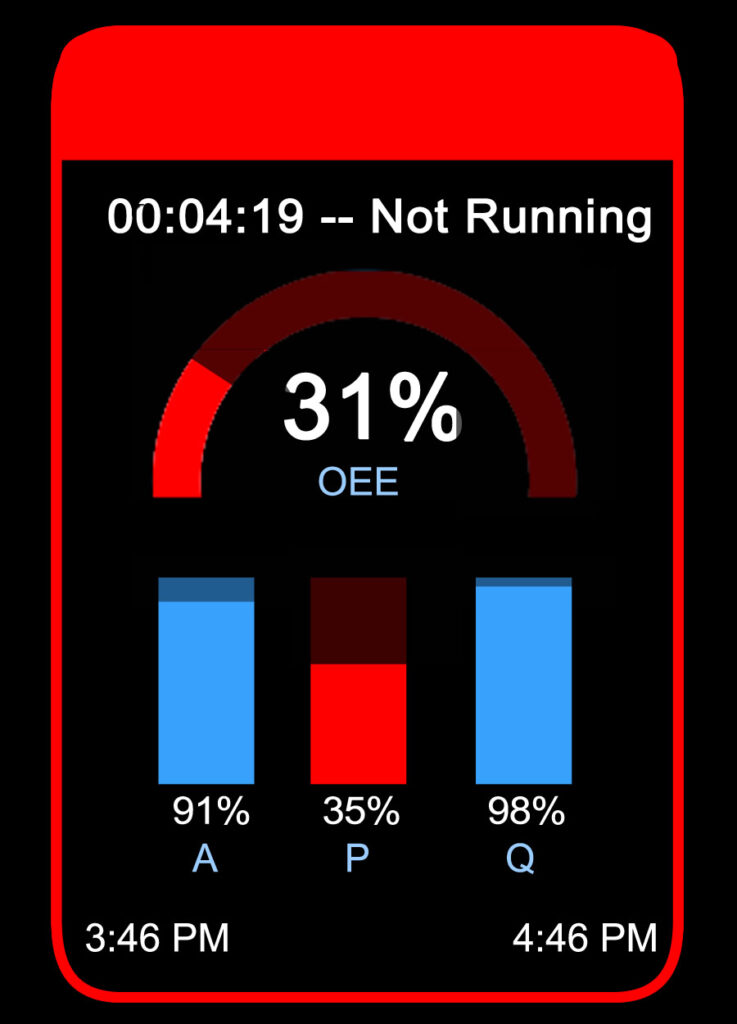
In this example, the machine is not currently running, but during the selected time period it has been running 91% of the time. The low overall rating is due to slow running, low performance.
We built an availability only andon board for mobile.
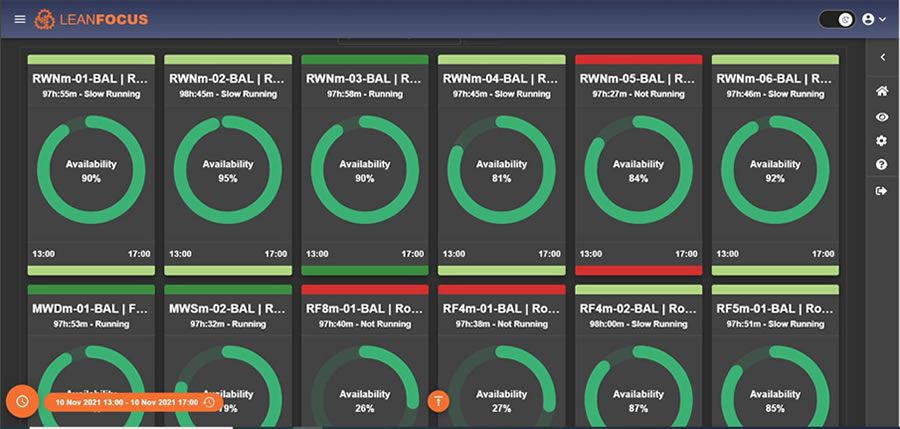
Because the client did not have real time quality ratings, we built an andon board that showed availability through a dial guage and color coding to show running, not running and slow speed.
This image is from the app currently being used by RingMetall.
