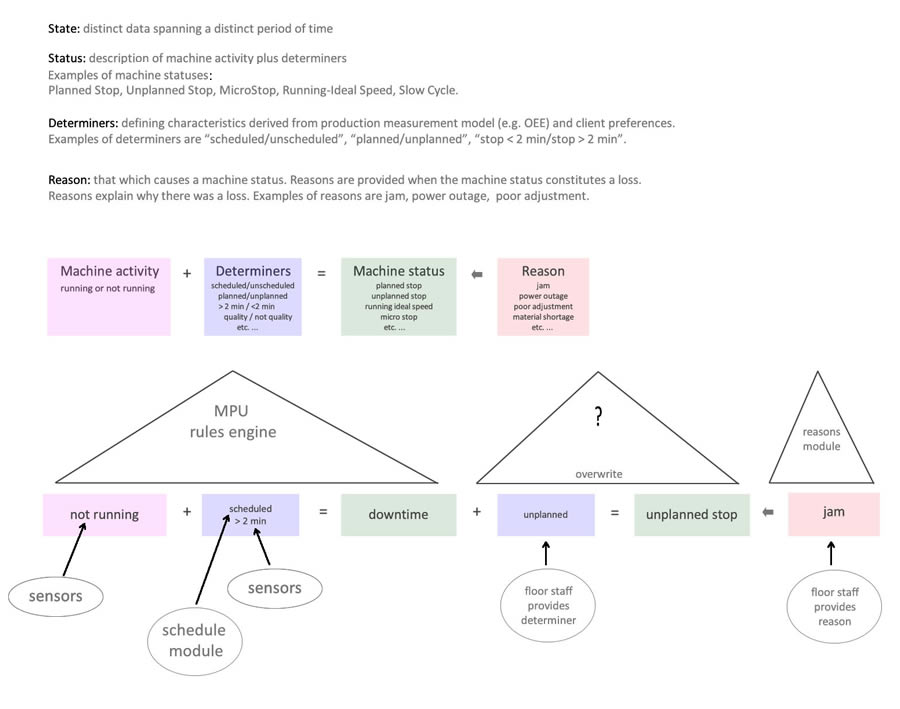
Our database would use minute states which enabled the app to assemble complex data presentations upon request. Here is one example where we had to first gain a common understanding of where data was coming from, which module was handling the data, how the data was interpreted and how it was stored. In order for our app to show the machine status we needed to know if it was running or not, if it was scheduled to run or not, how fast it was running, what that meant according to the users preferences, and if not running or not running at full speed or not producing 100% quality, what reason the machine was experiencing losses. Here is a sketch from one of our meetings. And, of course, we needed to define our terms.

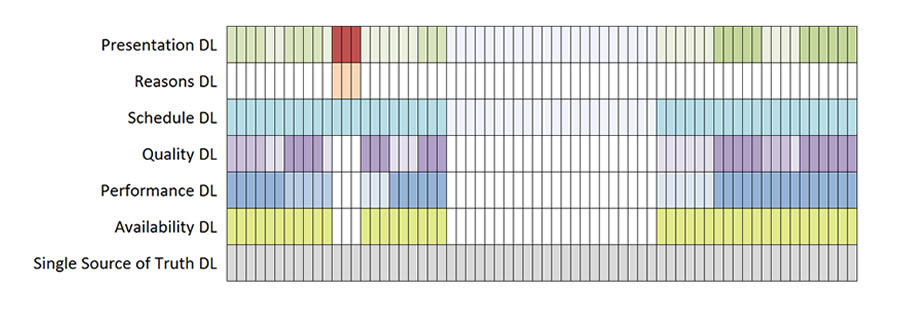
After we had defined our terms and understood the data process, we could create the following data layers:
